Connect your data
SCADA, AMI, GIS records, weather, LiDAR and imagery, and asset specs: whatever you already have or can remotely access.
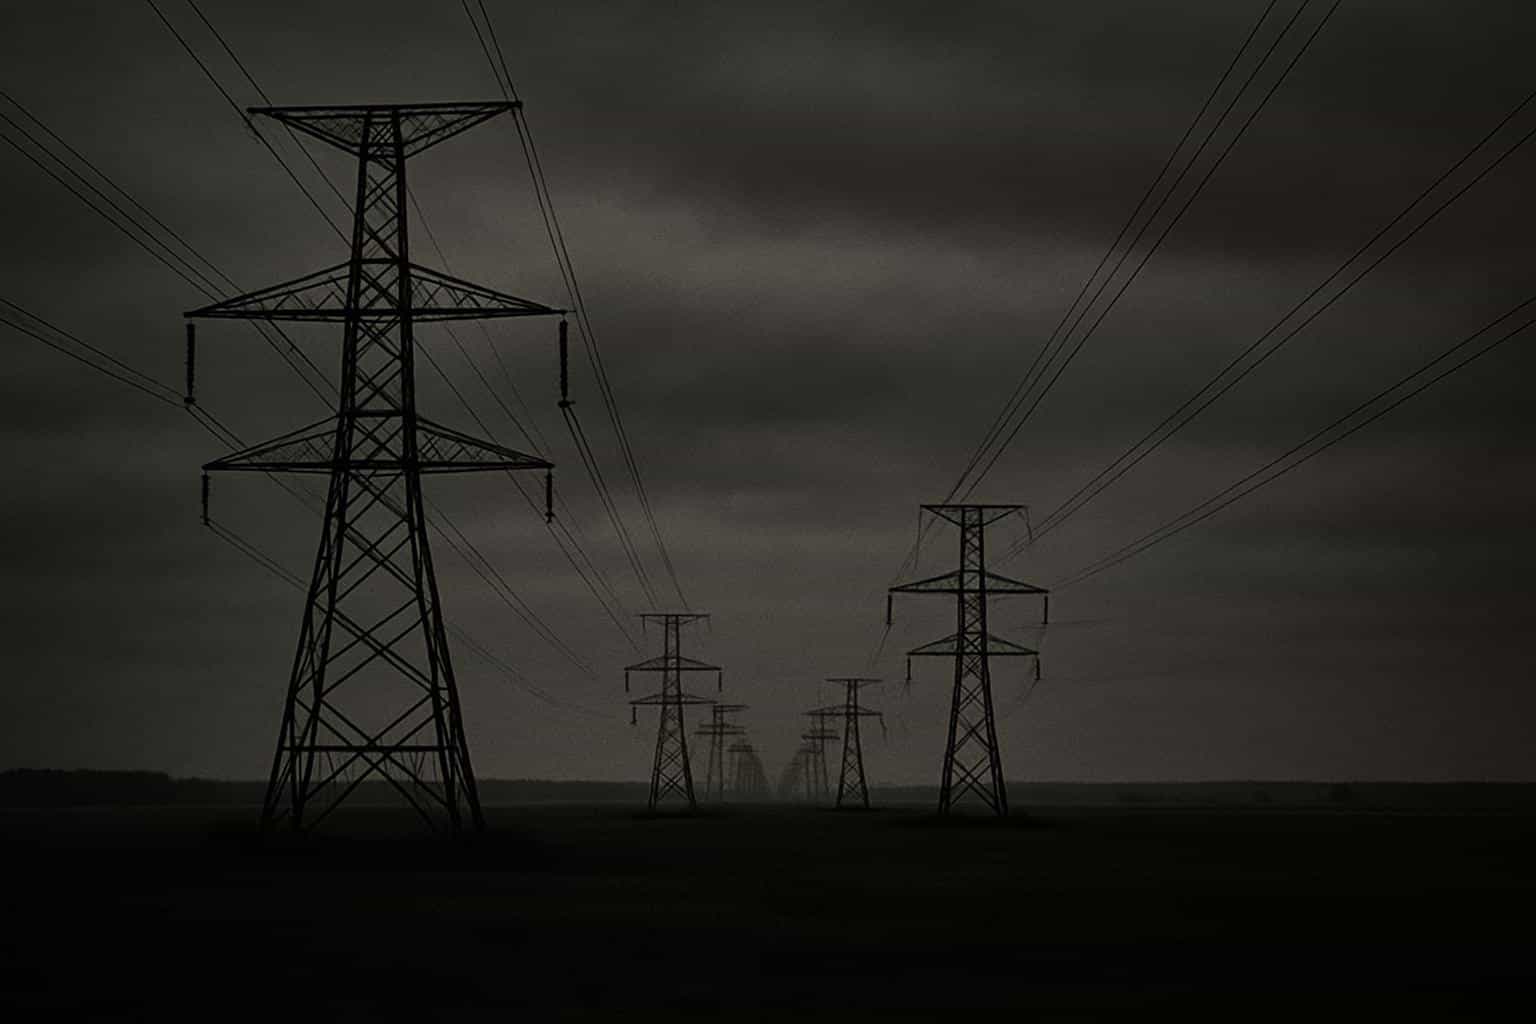
GridSight®. One Digital Twin.
Zero Blind Spots.
01 / Weather monitoring
Air, wind and conductor temperature feed the Dynamic Line Rating assessment.
Rain · baseline
Illustrative conditions · time compressed
02 / Line capacity
Colder air and stronger wind cool the conductor, increasing thermal headroom in this scenario.
Rain · baseline
—Estimated ampacity · rain baseline
Illustrative rating · no conductor icing modelled
03 / Vegetation management
The shortest distance from the conductor to the modelled canopy. Magenta marks foliage inside the pruning target.
Illustrative vegetation envelope · project criteria, not a regulatory limit
04 / Wildfire Prevention
Track a lightning ignition as fire spreads through the surrounding vegetation. The plum zone marks a proposed fuel-management buffer along the corridor.
Dry thunderstorm · monitoring
Wind, fuel moisture and vegetation continuity guide management priorities.
Illustrative dry-storm scenario · cross-section measurements · project target, not a universal safe distance
05 / Conductor geometry
The solid measure shows sag below the attachment reference. The dashed vertical ruler measures clearance to the ground at that point.
—Maximum vertical sag
Measured from the geometry shown · illustrative span
06 / Tower structure
Follow the steelwork, attachment points and base to prepare the work on each support.
Steelwork & protective coating
Connections & insulator attachments
Alignment & orientation
Base position & anchorage
Illustrative inspection points · height from the model, not a structural condition assessment
07 / Network State Estimation
Follow the feeder's branches through neighborhoods, local businesses and a high-demand industrial area.
Faster, denser plum pulses indicate higher relative demand.
Illustrative states · sparse measurements inform estimates across the network
Full grid visibility
without deploying new hardware.
Enline turns the physical parameters utilities already have into a live digital twin of the entire network. Full grid visibility at a fraction of the cost of conventional solutions.
Supporting power grids worldwide.































Different gains for every use case.
Real-time thermal ratings and N-1 contingency screening reveal more transfer capacity on lines already built, without adding infrastructure.
GridSight®: The multiphysics digital twin.
Aging grids, rising renewable integration, and limited visibility into line conditions. The traditional fix, installing sensors along every span, is slow, limited and expensive. Enline solves this with a software-only digital twin that turns data utilities already have into intelligence they can act on.
A real-time, 360° view of your network’s conditions: thermal, electrical, mechanical and environmental, resolved into one calibrated model, continuously updated as conditions change.
SCADA, AMI, GIS records, weather, LiDAR and imagery, and asset specs: whatever you already have or can remotely access.
A physics-based digital twin of every span, tower and bus, continuously calibrated.
Electrical, thermal, mechanical and environmental behaviour solved together.
Dashboards, 3D views, maps and alerts turn the twin into decisions, across monitoring, planning and investment horizons.
Real projects. Real gains.
Proven in the field: grid operators running GridSight® in production.
Avg. capacity above design rating: 38 lines, ~1,100 km of 110-330 kV grid brought into a hybrid DLR view.
Read case studyData centers & large loads
Of discovered connection capacity, sustained by scientific evidence: a structured grid-readiness programme for a more reliable connection capacity request.
Read case studyMajor Latin American DSO
Non-technical losses detected from meter data the utility already had: statistical scoring plus ML classification, every flagged account ranked with evidence.
Read case studyOne Platform. Every grid.
One platform for transmission and distribution grids across the globe.
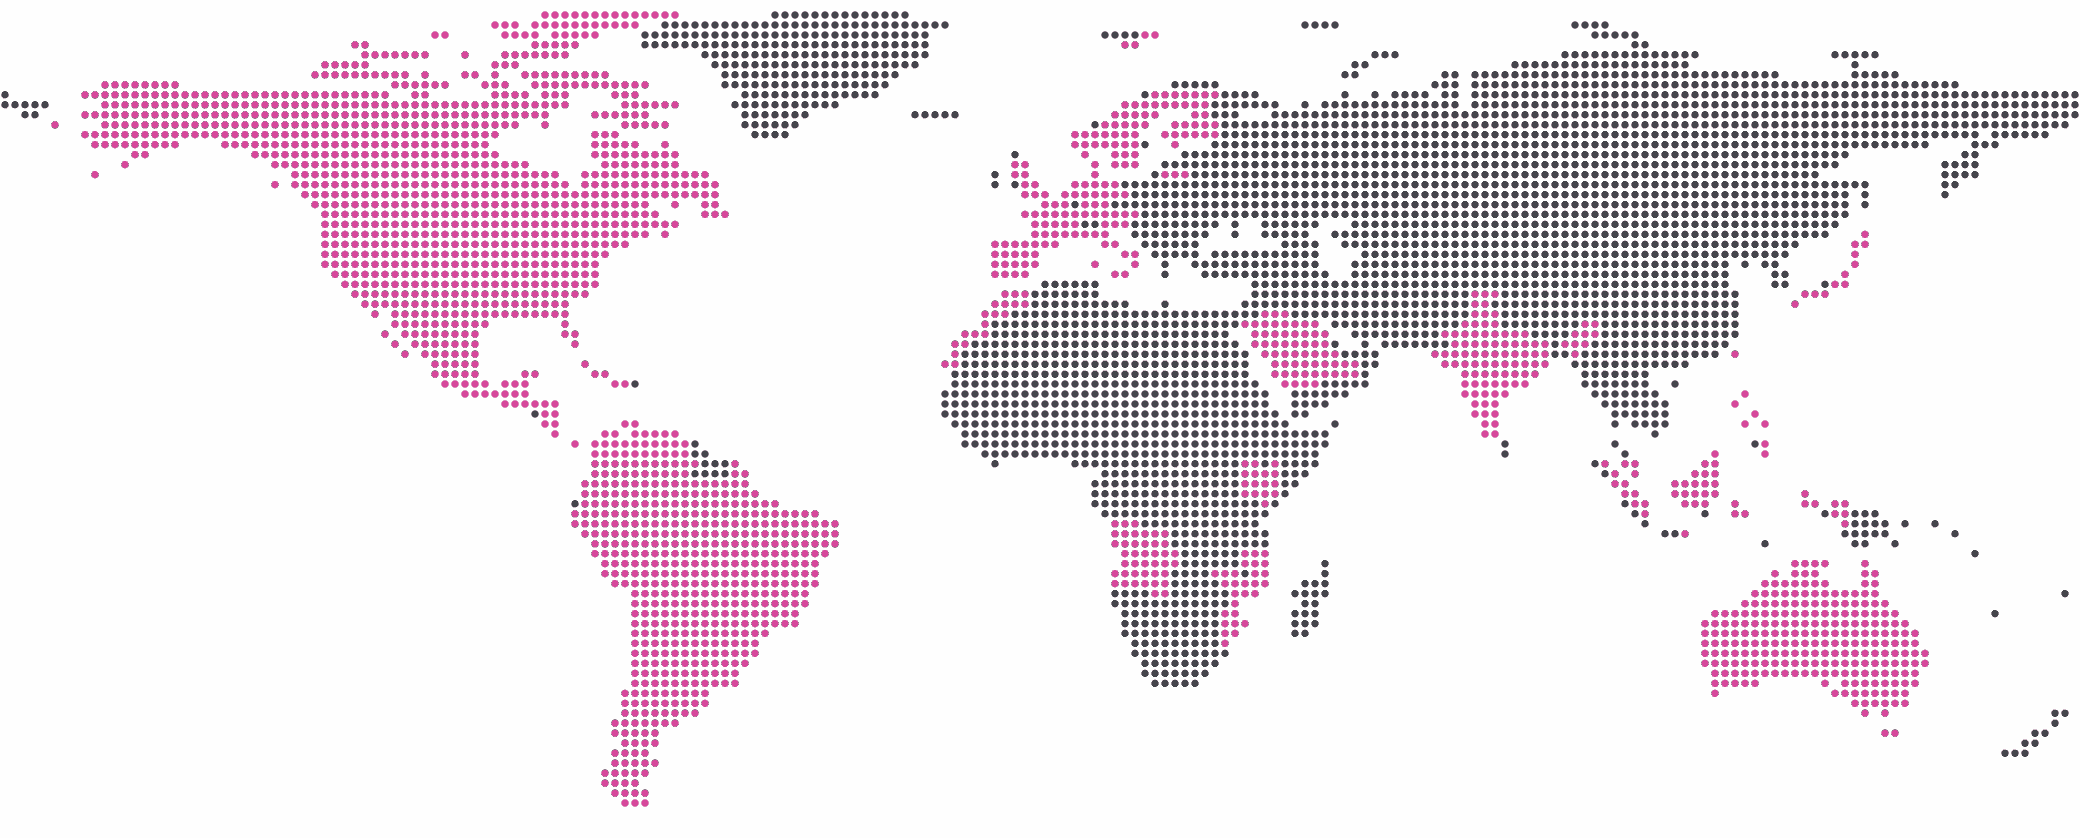
Canada, USA, Mexico, Guatemala, Belize, Honduras, El Salvador, Nicaragua, Costa Rica, Panama, Cuba, Dominican Republic, Haiti, Colombia, Venezuela, Ecuador, Peru, Bolivia, Brazil, Paraguay, Chile, Argentina, Uruguay
Portugal, Spain, France, Belgium, Netherlands, Germany, Austria, Lithuania, United Kingdom, Italy, Norway, Sweden, Denmark, Finland
Morocco, Angola, Mozambique, Kenya
Kuwait, Saudi Arabia, India, Malaysia, Japan, Taiwan, Indonesia, Philippines
Australia
The industry is taking note of our work.
Backed by the programs and institutions shaping the energy transition from
Google and ABB to TotalEnergies, Duke Energy and E.DSO.

Won in Paris, selected to represent the Portuguese startup ecosystem at Europe’s largest technology event.
Finalist for Enline’s Advanced Distribution Management System, recognising its contribution to distribution grid digitalisation.
Selected for TotalEnergies’ six-month accelerator for electricity and renewables startups, hosted at STATION F, Paris.

One of 29 startups chosen across North America and Europe for the inaugural cohort of Google’s AI for Energy accelerator.
Won the Distribution Solutions category from 164 applicants across 36+ countries, with a co-development project alongside ABB.
Won at DistribuTECH, recognising the solution’s relevance to the utility’s grid priorities.
Seeing the unseen grid
with Network State Estimation
 Gabriel PinoCTO & Co-founder, Enline
Distribution is barely measured, unbalanced, and constantly reconfigured. Watch Gabriel Pino, Enline’s CTO, walk through how GridSight® NSE turns the data you already own into a complete, confidence-scored picture of the grid, with real use cases and the full Q&A.